 Benny Tritsch
10 November 2026
A common mistake in EUC performance analysis is to start with user complaints and immediately look at the network. While network conditions frequently contribute to poor experiences, they are only one piece of the puzzle. The more systematic approach is:
In other words, first determine what the machine can do. Then determine what the user actually experiences, such as desktop responsiveness, application launch time, frame rate or screen artifacts. Ultimately, users should be at the heart of EUC environments.
Why perceived user experience matters in End-User Computing
When IT teams discuss the performance of virtual desktops, DaaS platforms, or remote applications, the conversation often revolves around technical metrics: CPU utilization, memory consumption, network latency, frame rates, and bandwidth. While these measurements are important, they do not always answer the most important question: How does the end user actually experience the system?
This is where EUC Score introduces a different perspective. Rather than focusing solely on infrastructure statistics, EUC Score is designed to measure and quantify the perceived end-user experience in remote application and digital workspace environments. The methodology combines simulated workloads, telemetry collection, screen video capture, and visual result analysis to create repeatable and comparable performance benchmarks.
What traditional monitoring tools can tell you is that a virtual machine consumed 75% CPU or that network latency increased by 20 milliseconds. However, these values do not necessarily reveal whether users noticed a slowdown while scrolling through a document, rotating a 3D model, watching a video, or interacting with a business application.
EUC Score bridges this gap by executing standardized workloads (Simloads) and screen recording the resulting user experience on the endpoint device and under controlled conditions. In combination with all other metrics, the collected screen recordings can then be compared across different platforms, protocols, network conditions, and optimization strategies.
Practical examples
The published EUC Score results showcase how seemingly small infrastructure changes can have a measurable impact on user experience. Recent test campaigns have compared:
These tests reveal that performance is not simply a matter of server specifications. In many cases, network quality, protocol efficiency, graphics acceleration, endpoint capabilities, and operating system optimization determine whether users perceive a session as smooth and responsive or frustratingly slow.
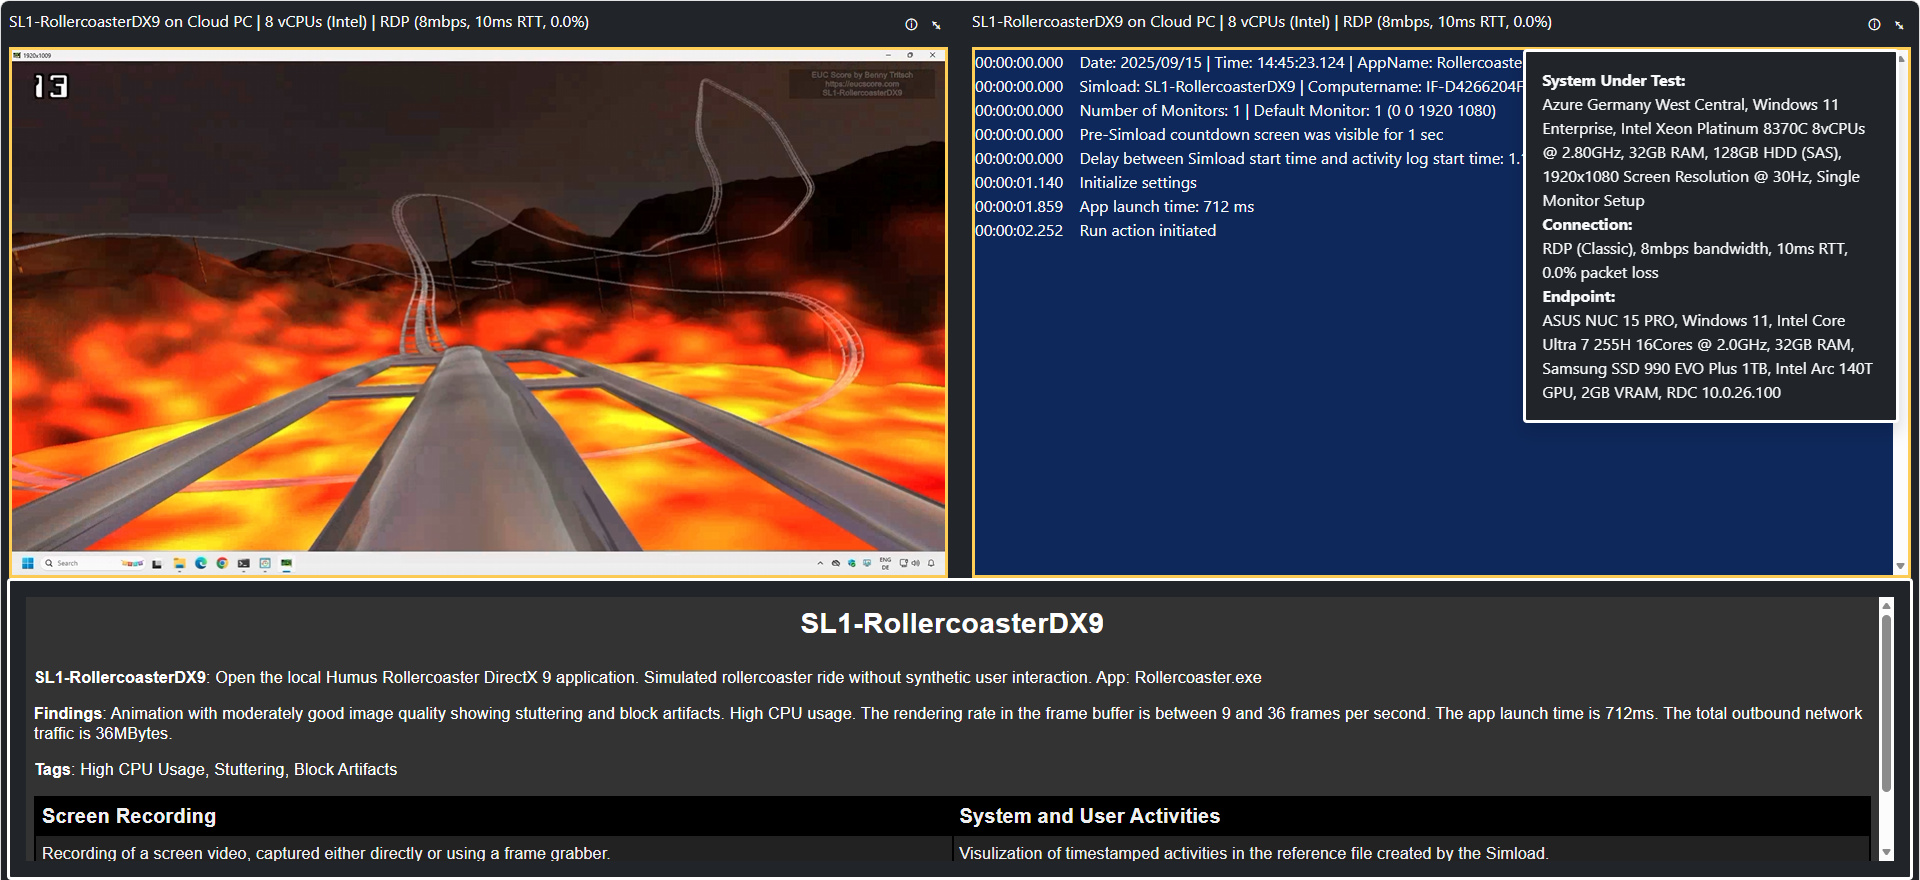
Unfortunately, it is not possible to assign a precise value or score to a specific perceived user experience—unlike performance measurement on the host side. Consequently, the screen recording of each test run must be carefully analyzed visually, described, and tagged. The corresponding nomenclature used in the findings was introduced by me in a previous article titled A Guide to Common VDI Screen Artifacts and What They Mean.
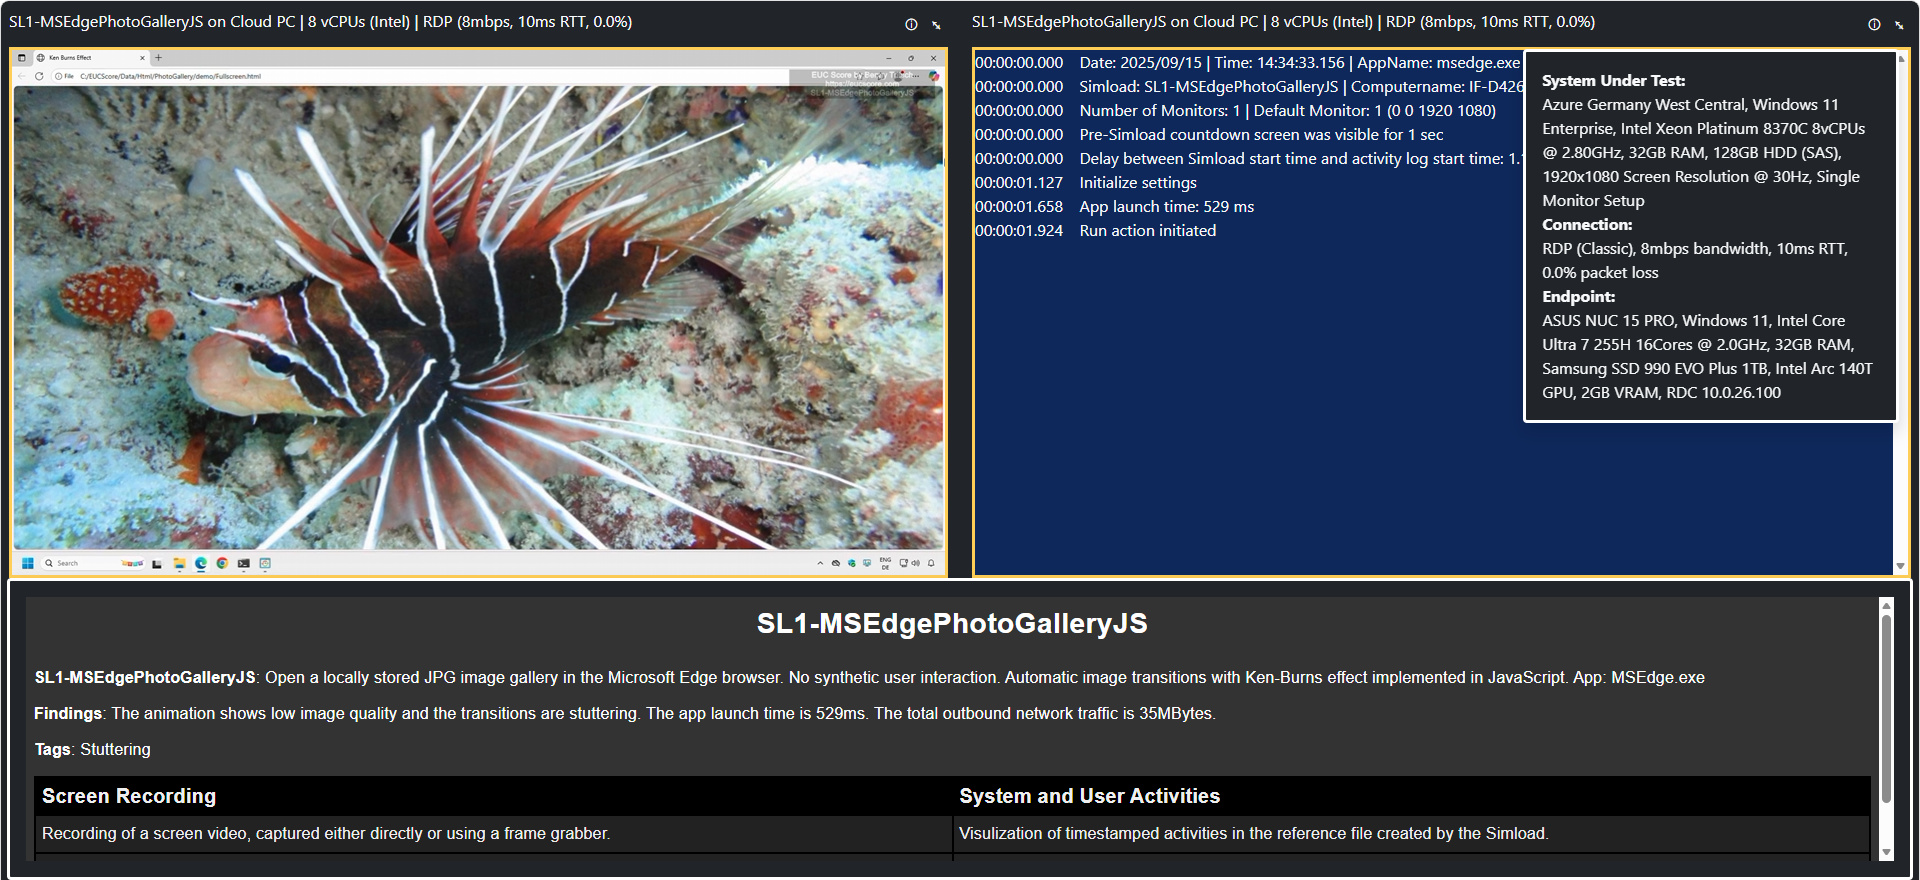
By comparing EUC Score benchmarking results and findings across multiple test scenarios, architects and administrators can answer critical questions:
Comparing screen videos and performance metrics of different EUC Score test sequences—archived in an ever-growing library—that utilize identical synthetic workloads allows for an objective answer to these types of questions. By using multiple workload categories, EUC Score evaluates different aspects of the digital workplace separately. This allows architects and administrators to identify strengths and weaknesses in specific areas rather than relying on a single aggregate number.