 Benny Tritsch
15 September 2026
Benny Tritsch
15 September 2026
In the first article of this series, I compared EUC benchmarking experts to home inspectors. The analogy highlights a simple principle: inspect before you commit, measure before you assume. In the second article, I explained why collecting detailed system information should be the first step of every benchmarking exercise. Hardware specifications, GPU capabilities, storage devices, operating system versions, and software configurations provide essential context for interpreting benchmark results. Without that information, performance numbers become difficult to compare and even harder to reproduce.
This third article focuses on a different question: How much performance potential does a machine actually have before network conditions and perceived user experience enter the picture? For virtual desktops and Desktop-as-a-Service platforms, discussions about performance often drift toward bandwidth, latency, packet loss, remoting protocols, and WAN optimization. These factors certainly matter, but they can also distract from an equally important consideration: the capabilities of the system itself. If the underlying machine cannot generate frames quickly enough, process graphics efficiently enough, or handle computational workloads smoothly enough, even a perfect network connection will not save the user experience.
The EUC Score methodology uses simulated workloads, known as Simloads, to generate repeatable and measurable activity patterns. Different Simload types serve different purposes. Some are designed to evaluate user experience under remoting conditions, while others focus on generating specific system workloads and collecting telemetry data. Among these types, Score Simloads have a unique role. They measure predefined system metrics or response times, used to produces a numerical value that represents a specific aspect of the system performance.
Each Score Simload is part of a predefined category. The Windows Controls category focuses on the responsiveness of the graphical user interface and common desktop interactions. The 2D Graphics category measures performance for visually intensive applications and modern web content. The Storage category evaluates how quickly and efficiently the environment handles disk-related operations. As organizations increasingly deploy GPU-enabled virtual desktops for engineering, design, scientific visualization, and immersive applications, an additional 3D Graphics category is planned for future releases.
The numerical result of each Score Simload serves as the starting value for a formula that uses a specific factor to calculate a value between 0 (= poor) and 10 or higher (= excellent). Combined, these values yield a score for each category or an overall score across all categories.
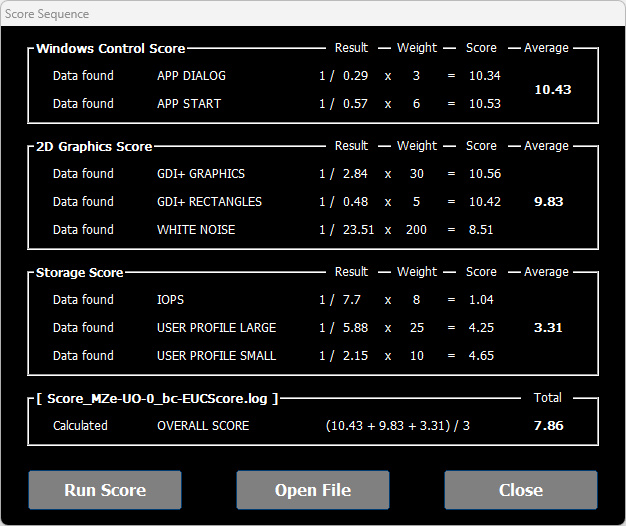
If you want to try it out yourself, go to the EUC Score freeware download page. From there, you can download the EUC Score Base Installation Package v26.09 which includes the brand new Simload Runner. After installation, launch Simload Runner and click the Score button. Then the score control opens which applies the current version of the score calculation formula, as shown in the image above. The score control allows you to run a score sequence and to open and visualize score log files collected during previous score sequences.
The goal of this scoring procedure is not to measure the network or the remoting protocol. Instead, the goal is to quantify the raw performance potential of the physical or virtual machine under test. Think of it as testing an automobile on a dynamometer. The test is performed in a controlled environment that removes as many external influences as possible. You are not measuring traffic congestion, weather conditions, or road quality. You are measuring the capabilities of the vehicle itself.
The same principle applies here. When EUC benchmarking results show that one virtual desktop performs better than another, the immediate temptation is to attribute the difference to the remoting protocol or network connection. In reality, there may be significant differences in the underlying hosts:
A machine-level score gives us a baseline that helps explain later user experience measurements. For example, if two desktop environments use the same remoting protocol but one consistently delivers smoother graphics and faster application responsiveness, Score Simload results may reveal that one environment simply has substantially more graphics-processing capability available.
Conversely, if two systems achieve similar machine scores but produce very different user experiences during remoting tests, the investigation can shift toward network conditions, protocol behavior, or endpoint constraints. In a nutshell, the most important aspects of Score Simloads is that they create a performance fingerprint for a system. Instead of describing a desktop merely as "8 vCPUs with 32 GB RAM," the benchmarking results begin to characterize how the machine behaves under specific workload categories. The resulting scores create an objective, repeatable basis for comparison across:
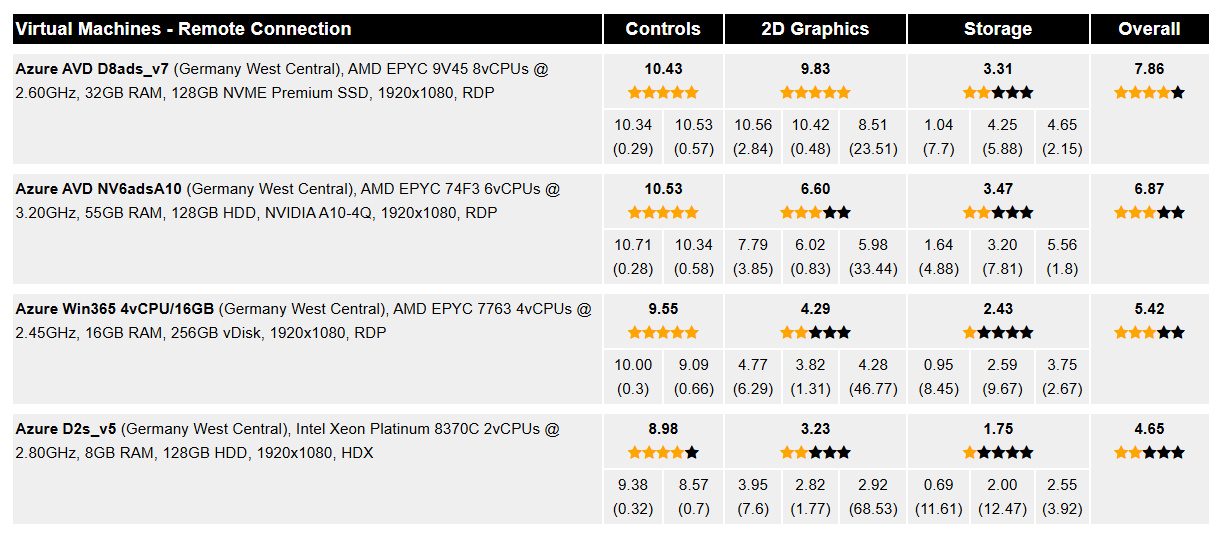
Examples of these comparative scoring results can be found on this web page, where identical Score Simloads are used to evaluate and compare different systems under controlled conditions.
In the next article of this series, we will look at how Score Simload results can be correlated with real-world user experience measurements, closing the gap between machine performance metrics and perceived user experience.